We are constantly bombarded with information – finding the data and research that is relevant to you and your business and how to interpret it; yet few of us have the time or the knowledge to do so, yet we know it’s important.
MBIE and Stats NZ are the source of most our tourism data – this is what the government, councils, regional tourism organisations and tourism businesses rely on.
So thanks to RTONZ we spent a day at MBIE to find out more about this data, how it is collected, how it is interpreted, and how to find the data we need, along with representatives from RTOs around New Zealand.
A particular interest of mine was finding out more about the International Visitor Survey, or the IVS.
If you’ve looked at the IVS data, especially around the activities undertaken by visitors, you may have had some of the same questions I did (not paying as much attention in maths and stats as I should have at school) – how does 182 people saying they took part in an activity with dolphins while in New Zealand magically equate to 43,050 visitors doing so in the IVS tables that MBIE released? It’s all to do with weighting and statistics; there are formulas and calculations to ensure the numbers are viable, made by those who did pay attention in stats class. Just under 10,000 visitors fill in the IVS each year (approximately a third of those that are contacted). Those visitors have to fit certain criteria – i.e. purpose of visit (they can’t be here to attend a recognised educational institute, for example). They try to get a spread from departing ports, and cover a range of countries of origin. One interesting tidbit I picked up is that the IVS doesn’t engage with cruise passengers – only those who depart at Auckland, Wellington, Christchurch, and Queenstown airports. I found the primary reason for this very interesting – a cruise passenger who is in New Zealand for less than 28 days is considered under immigration law to only be in transit, therefore cannot be surveyed!
In the airports, potential visitors are approached and screened to see if they fit the criteria. If they do, and they agree, they provide their email address for the purpose of being emailed the survey upon their arrival home. There are several schools of thought as to whether this method is the best for gathering the relevant data at a time when it’s still fresh in the mind of visitors to our shores – it has been raised that perhaps it may be an option for visitors to fill out the survey while they are in the departure lounge, or in the airport bus on their way to the airport (one way to fill in the 60 minute ride from Queen Street to Auckland International Airport!) The use of incentives has also been raised.
Their responses are then weighted. MBIE’s website on the IVS states that “each respondent within the sample is weighted to represent their fraction of the total number of all international visitors departing New Zealand within the survey’s target population. Survey response weights are adjusted to reflect the unequal probabilities of respondent selection from the composition of the target population, and known discrepancies between the sample and the population definitions.”
I suppose it comes down to whether 9,700 participants in the last year accurately reflect the activities and spending habits of the nearly 3 million visitors that we had. With so many technological advantages at our fingertips now, are there other ways we can capture the data that we want and need as an industry to back up that we receive from the IVS? I don’t think we’ve begun to tap the possibilities of social media, or location services in terms of getting us the data we want. Perhaps exploring relationships with Facebook and Instagram into how many people post photos or updates from particular locations?
Could tourism operators be asked to help with gathering the data? It would have to be done in a very simple and easy way so that it didn’t impinge on both their core work, and the overall experience of the visitor.
Is there an app that could be made available for a visitor to download at the start of their time in New Zealand and for a small incentive, update it each day with their activities, spending, and region(s) visited? That way the information is still fresh in their mind and is a couple of minutes out of their day, rather than sitting down when they get home to fill it in with details of events that could have taken place days, weeks, or even months earlier.
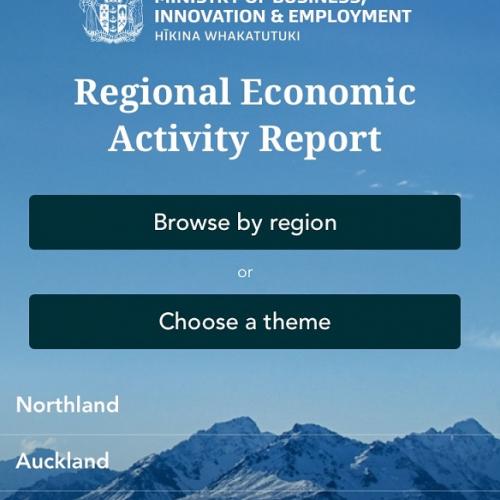
Another interesting product we were able to explore was the Regional Economic Activity Report.
This fantastic piece of work enables anyone to navigate different data sets for a region – not only limited to tourism, but household incomes, internet access, housing and rental costs, employment and job data, education, population, agriculture, and economic data. The tourism data includes guest nights per capita, accommodation occupancy rates, tourism spend, international guest nights, and international visits.
You could spend hours on there – it’s incredibly easy to navigate, and it’s also available as a smartphone app – handy for when you’re on the road and need to pull up the data for your region quickly and easy! MBIE will constantly be updating it with the latest data, but in the meantime have a look around and let us know what you think.


